
")
")
Glycoprofiling strategies for antibodies and biosimiliars
Relative quantification of glycosylation heterogeneity
Quantification of glycosylation species is required to evaluate batch variability and to further optimize processes. This is accomplished by generating extracted ion chromatograms (XIC) for differentially glycosylated species of a respective peptide. The resulting peak areas are used for relative quantification of glycosylation species. Figure 1 shows the XICs of different glycoforms of a proteolytic peptide from a commercial therapeutic antibody which co-elute in LCMS. High-resolution mass spectrometry allows data extraction in narrow mass windows to allow highly specific and accurate quantification (see table 1).
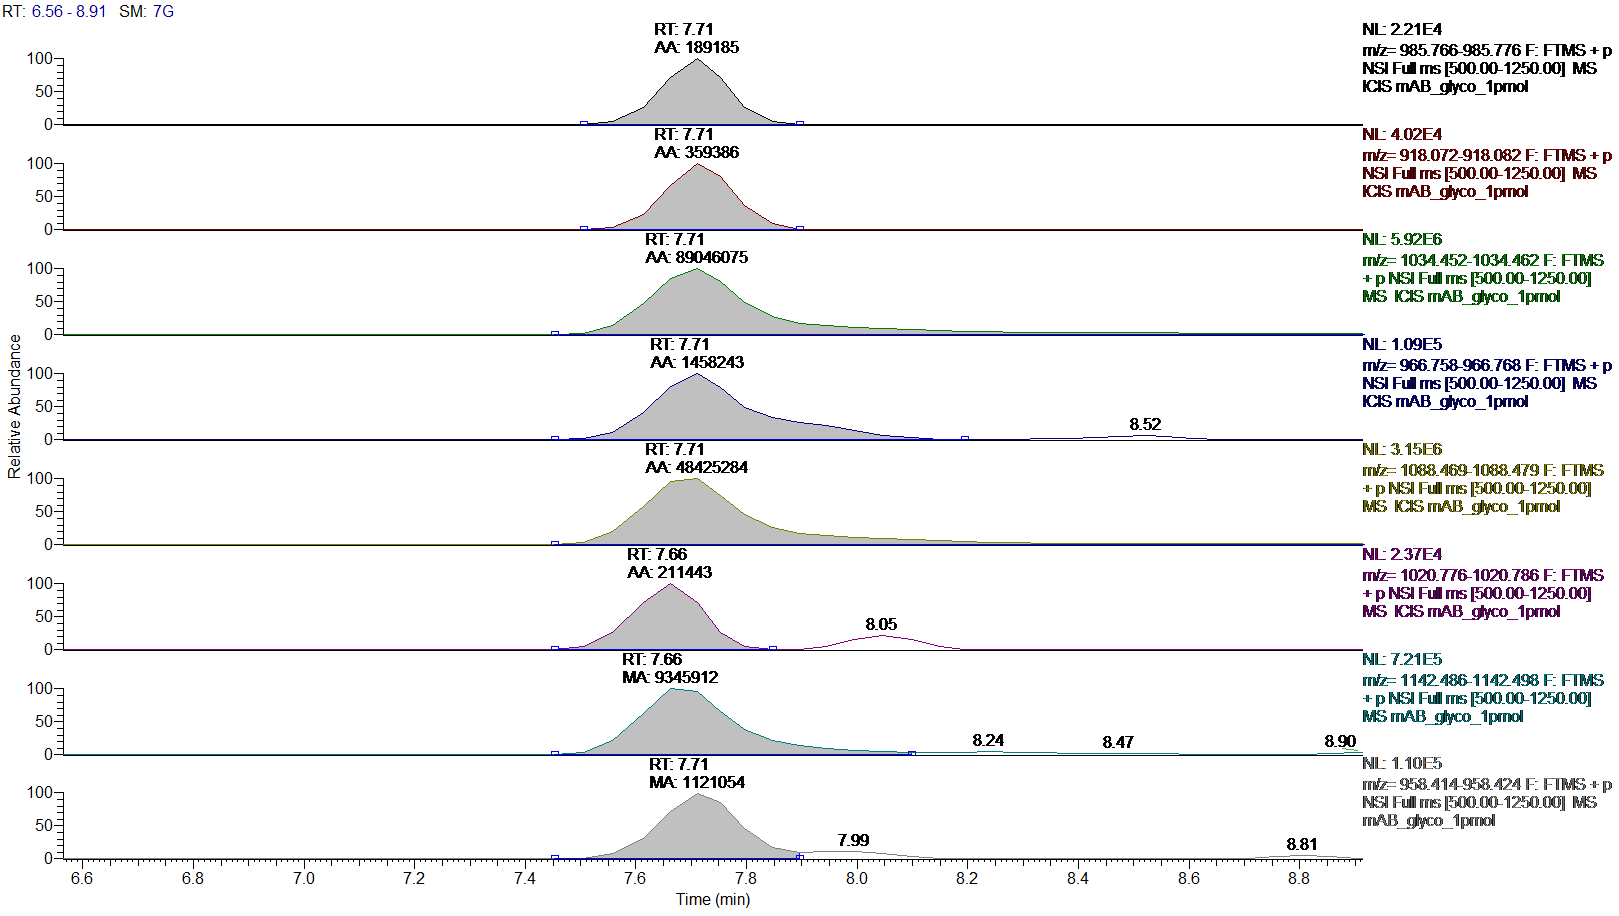
Figure.1: Extracted ion chromatograms (XIC) with peak areas for co-eluting glycosylation forms of the tryptic Fc-fragment peptide K.TKPREEQFNSTYR.V
Order of XICs: G0, G0-GlcNAc, G0F, G0F-GlcNAc, G1F, G1F-GlcNAc, G2F and Man5.
The corresponding mass spectra (Figure 2) reflect these proportions and allow validation of correct charge states and glycan structure thanks to high resolution of mass spectrometry data (Figure 3).
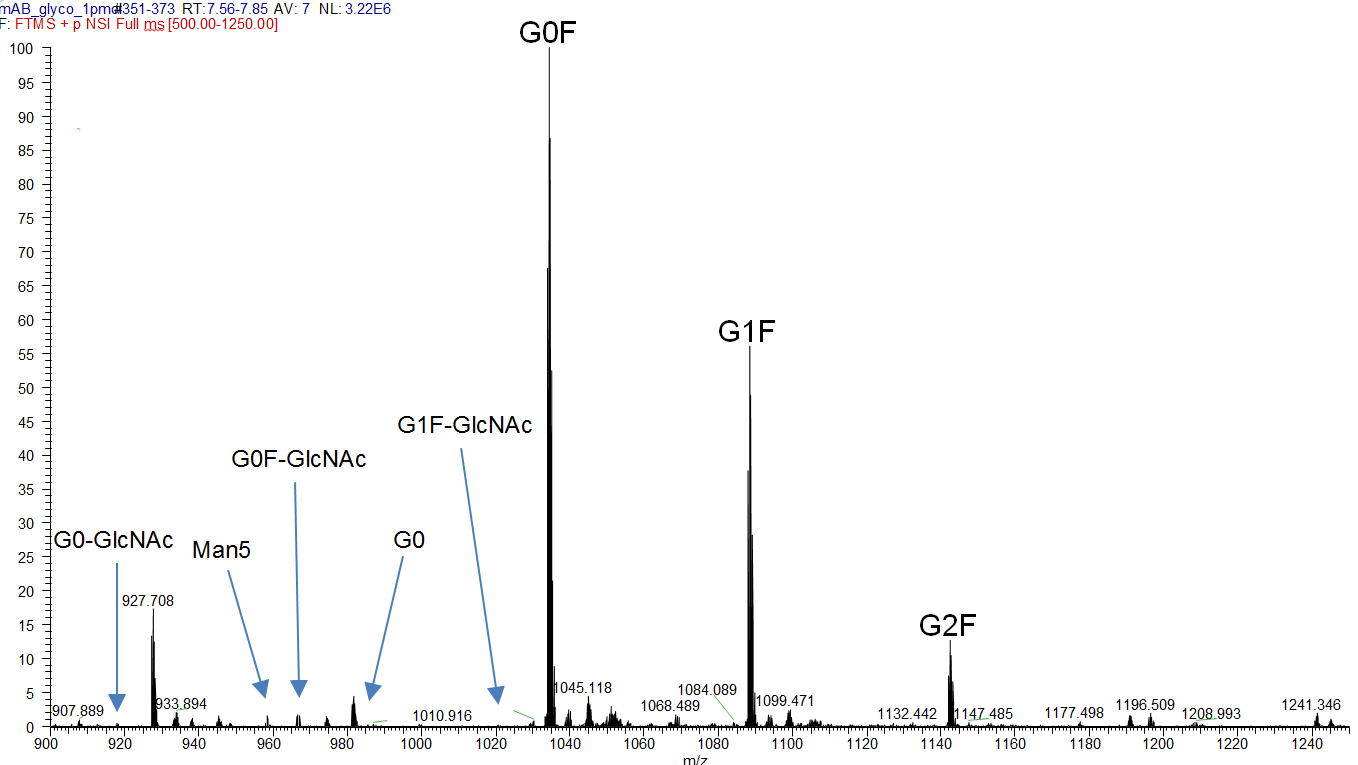
Figure 2: MS spectrum of the tryptic Fc-fragment peptide K.TKPREEQFNSTYR.V with different glycosylation species ([M+3H]3+).
Table 1: Portion of different glycosylation species of the tryptic peptide K.TKPREEQFNSTYR.V
| Description | |||
| K.TKPREEQFNSTYR.V | area | portion [%] | |
| G0 | 189185 | 0.1 | |
| G0-GlcNAc | 359386 | 0.2 | |
| G0F | 89046075 | 59.3 | |
| G0F-GlcNAc | 1458243 | 1.0 | |
| G1F | 48425284 | 32.2 | |
| G1F-GlcNAc | 211443 | 0.1 | |
| G2F | 9345912 | 6.2 | |
| Man5 | 1121054 | 0.7 | |
| Sum: | 150156582 | 100 |
Characterization of glycosylation species
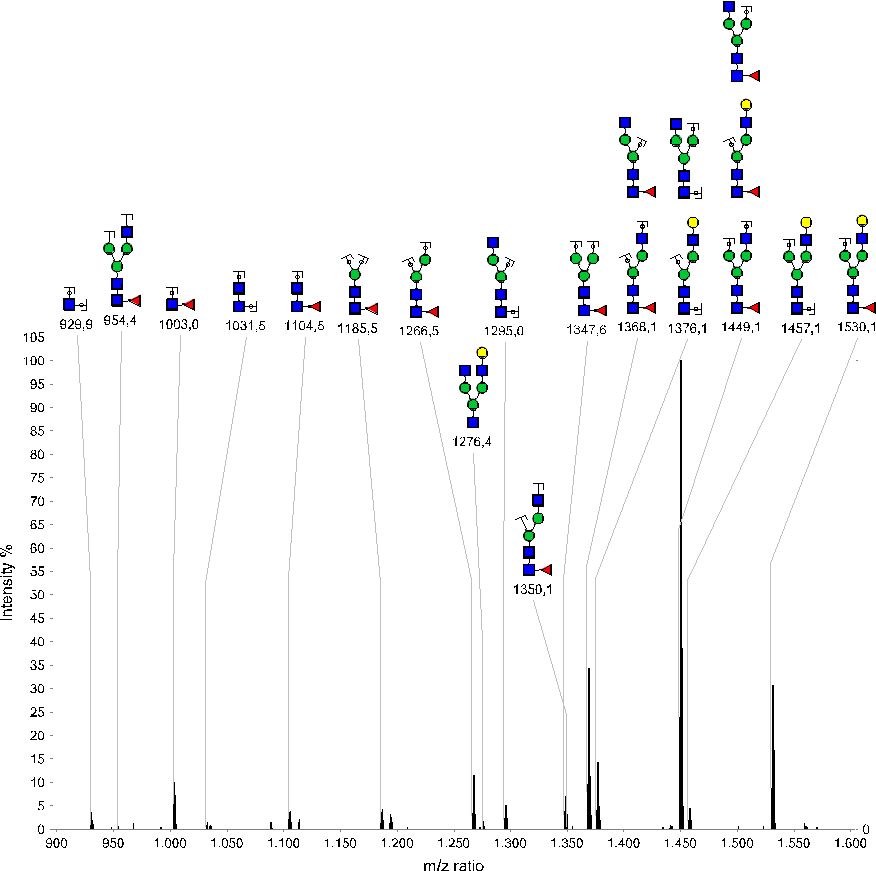
Figure 3: MS² spectrum (zoom of 900-1600 m/z) of K.TKPREEQFNSTYR.V glycosylation G1F (parent = 1088.138 m/z, z=3). Annotated peaks show various fragments of the glyco-structure G1F.